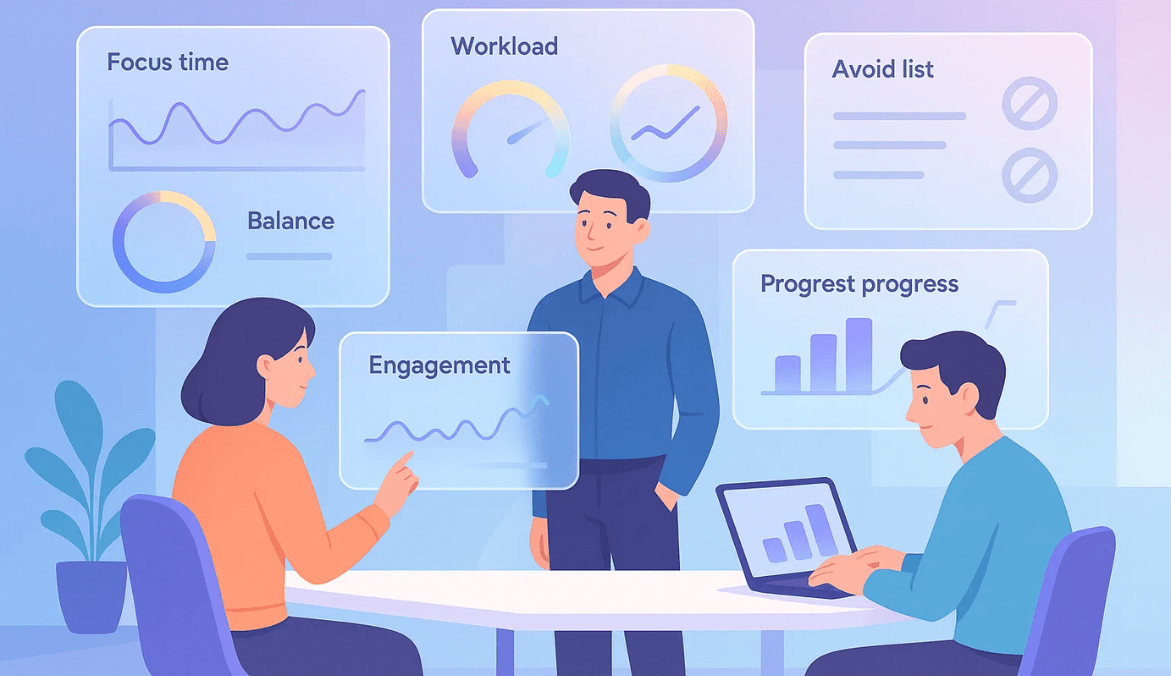
The 80/20 of a Great Productivity Dashboard
The best employee productivity dashboards don’t measure everything — they measure what matters.
Focus on 5 must-track metrics that actually influence results (focus time, throughput, quality, engagement, and workload balance).
Avoid vanity indicators like total hours logged or random app switches — they create noise, not insight.
If you build a dashboard that helps people, see themselves instead of proving themselves, you’re already ahead of 80% of companies.
What an Employee Productivity Dashboard Actually Is (and Isn’t)
An employee productivity dashboard is a real-time visualization of how work happens — across individuals, teams, and time.
It’s not a “surveillance board.” It’s a feedback system that connects effort to outcomes.
Think of it as a flight dashboard: you don’t need to see every button — only the few that keep you in control and on course.
In practical terms, it aggregates metrics like focus time, task throughput, project cycle time, and engagement scores to give you a pulse on performance.
From experience: When I first introduced productivity dashboards years ago, most teams treated them like control panels. Over time, I learned that the real power comes when dashboards become mirrors — tools that help people see their own patterns and improve without being told.”
The Metrics That Matter (With Simple Formulas)
Before adding a widget or graph, ask: Can this metric drive a useful decision?
Leading Indicators (predictive signals)
These show early warning signs before performance dips:
- Focus time ratio: distraction-free minutes ÷ total work minutes
- Context-switch rate: average app or task switches per hour
- Work in progress (WIP): open tasks per person vs. limit
- Queue aging: tasks waiting beyond SLA or due date
- Coaching cadence: number of one-on-ones completed / planned
Lagging Indicators (results)
These measure impact after the work is done:
- Throughput: total completed tasks per FTE
- Cycle time: average duration from start to delivery
- Quality rate: (total output − rework) ÷ total output
- Utilization: productive hours ÷ paid hours
- On-time delivery / CSAT: project or client satisfaction metrics
A Gallup’s study found that employees who clearly understand what’s expected of them are 47% less likely to experience burnout — a key driver of lost productivity. Dashboards that connect leading and lagging metrics help teams see those expectations clearly and act before fatigue sets in.
Real-world lesson: In one project with a remote tech team, we discovered that tracking ‘context switches per hour’ was a stronger predictor of burnout than idle time. That small insight helped managers restructure workflows and cut fatigue dramatically.”
Pro tip: Always balance leading and lagging metrics — one tells you where you’re heading, the other confirms where you’ve been.
Role-Based Views: One Dashboard Doesn’t Fit All
A great dashboard isn’t just about metrics — it’s about perspective.
- Executives: need trendlines and ROI per team.
- People managers: want to see balance — not who worked most, but who might be overloaded.
- Individual contributors: need personal dashboards that help them self-reflect and plan better.
- Ops/HR analysts: track cross-team comparisons and engagement patterns.
From 10+ years of practice: Over the years, I’ve built dashboards for everyone from CEOs to interns. What I’ve found is that leaders want trends, not timestamps.
Meanwhile, employees prefer self-views that help them track focus and flow. A good dashboard speaks both languages.”
When each role sees relevant insights (and nothing extra), data builds trust instead of anxiety.
Recommended Widgets & Layout
At-a-Glance Summary (top strip)
- Utilization %, throughput/FTE, quality rate, focus time trend
Workload & Focus Section
- Focus vs. meeting hours chart
- App/context switch histogram
- Time spent on deep vs. shallow work
Bottlenecks Section
- Heatmap for SLA breaches or overdue tasks
- Flow diagram showing where work gets stuck
Engagement & Enablement Section
- Coaching or feedback sessions held
- Training completion vs. output quality
AI & Automation Metrics (2025-ready)
- Copilot/Viva usage and ROI comparison
- AI task adoption vs. manual work trend
According to Gallup’s Report, only 33% of employees worldwide say they’re thriving at work. When dashboards focus too narrowly on activity metrics instead of well-being and balance, they risk amplifying disengagement — not productivity.
Pro tip: Don’t crowd the dashboard. Keep a “less is more” mindset — 6 KPIs per view are enough for action.
Build vs. Buy: Choosing the Right Path
Buy (pre-built tools):
Perfect if you need fast rollout and built-in analytics. Tools like ActivTrak and Hubstaff come with productivity templates.
Build (Custom BI tools):
Ideal if you already collect granular data. Use Power BI, Retool, or Google Data Studio to create tailored views for different roles.
If you’re scaling fast or have compliance needs (like data residency or redaction), a hybrid model works best — buy first, then customize.
Data Governance & Privacy-by-Design
Modern dashboards must follow a privacy-first architecture:
- Gather minimal data — only what’s actionable.
- Enable self-visibility so employees can see what’s tracked.
- Restrict admin access; keep team leads at the “summary” level.
- Mask or redact screenshots where possible.
- Define retention periods and review access logs quarterly.
This step turns dashboards from “monitoring” tools into trust engines.
What to Avoid (The KPI Hygiene List)
Every metric that looks helpful isn’t.
Here’s what to skip — and why:
- ❌ Vanity metrics: total hours logged or mouse movement time.
- ❌ Single-score ratings: one “productivity percentage” hides context.
- ❌ Over-surveillance: using screenshots as the main measure of output.
- ❌ Unnormalized comparisons: comparing roles with completely different work patterns.
- ❌ No baseline: measuring improvement without a starting point.
Lesson learned: Early in my career, I made the mistake of ranking teams by total hours logged. It crushed morale overnight. That experience taught me that dashboards should highlight outcomes, not effort.
A good productivity dashboard drives curiosity, not fear.
Benchmarks & Targets — Setting Realistic Goals
Don’t copy another company’s numbers. Instead:
- Use internal history (compare quarter-over-quarter).
- Identify cohort benchmarks (top 20 % vs. average).
- Reference published sector data (ActivTrak, Microsoft Viva Benchmarks).
- Revisit targets quarterly — automation or new tools can shift baselines fast.
According to Gallup’s report, organizations with highly engaged employees report up to 22% higher productivity than those with low engagement levels. This shows that the most effective benchmarks aren’t just numerical — they’re cultural. When teams feel connected to meaningful goals, performance naturally rises.
Remember: Benchmarks are reference points, not report cards. Use them to ask better questions, not to judge.
14-Day Implementation Plan
| Day | Step | Outcome |
|---|---|---|
| 1–3 | Define purpose & stakeholder goals | Everyone aligned on “why” |
| 4–7 | Audit data sources & choose tool | Clear visibility map |
| 8–10 | Build first draft dashboard | Pilot visuals ready |
| 11–12 | Share pilot with one team | Collect feedback & refine metrics |
| 13–14 | Launch company-wide beta | Document glossary & review cadence |
This keeps momentum high and prevents endless dashboard planning cycles.
Closing Thoughts
A productivity dashboard isn’t about policing — it’s about clarity.
Final reflection: “The most impactful dashboards don’t just measure performance — they spark meaningful conversations. When people understand their own data, accountability turns into ownership.”
When you design for visibility and humanity, numbers stop being threats — they become insights everyone can trust.
FAQs
Leading & lagging KPIs: focus time, throughput, cycle time, quality, and engagement.
Metrics show activity; outcomes show impact. Both need each other.
Only when employees know what’s tracked and why. Transparency is non-negotiable.
Start with internal history; adjust as teams and tools evolve.
If speed and support matter, buy. If customization and control matter, build.
 Gift Card ₹999


